| 3BM070: Strategic Corporate Finance |
Information for Tasks 1 and 2
You work in the corporate finance department of a major investment bank. One of your clients has expressed an interest in investing in either ASOS (ASC:LSE) or Marks and Spencer (MKS:LSE).
You have collected the following information about the two companies:
| Statement of financial position as at: | 31 August | 1st April | |||
| ASOS | Marks and Spencer | ||||
| 2017 | 2016 | 2017 | 2016 | ||
| £m | £m | £m | £m | ||
| Non-Current assets | |||||
| Property plant and equipment | 137.4 | 77.2 | 4,837.8 | 5,027.1 | |
| Intangible assets | 178.0 | 113.5 | 709.0 | 802.8 | |
| Other | 10.5 | 13.3 | 1,022.4 | 1,185.1 | |
| 325.9 | 204.0 | 6,569.2 | 7,015.0 | ||
| Current assets | |||||
| Inventories | 323.3 | 257.7 | 758.5 | 799.9 | |
| Trade and other receivables | 28.6 | 15.0 | 318.6 | 321.1 | |
| Other | 0.0 | 0.0 | 177.6 | 92.8 | |
| Cash and cash equivalent | 162.6 | 173.3 | 468.6 | 247.6 | |
| 514.5 | 446.0 | 1,723.3 | 1,461.4 | ||
| Total assets | 840.4 | 650.0 | 8,292.5 | 8,476.4 | |
| Equity | £m | £m | £m | £m | |
| Issued Called | 2.9 | 2.9 | 406.2 | 405.8 | |
| Share premium | 6.9 | 6.9 | 416.4 | 411.3 | |
| Retained earnings | 327.2 | 254.7 | 6,648.1 | 6,927.5 | |
| Other | (49.9) | (64.1) | (4,320.3) | (4,301.2) | |
| Total equity | 287.1 | 200.4 | 3,150.4 | 3,443.4 | |
| Non-current liabilities | 9.1 | 21.0 | 2,774.1 | 2,928.2 | |
| Current liabilities | |||||
| Trade and other payables | 480.7 | 370.7 | 1,553.8 | 1,617.7 | |
| Current tax liabilities | 5.8 | 2.9 | 66.6 | 75.2 | |
| Other | 57.7 | 55.0 | 747.6 | 411.9 | |
| 544.2 | 428.6 | 2,368.0 | 2,104.8 | ||
| Total liabilities | 553.3 | 449.6 | 5,142.1 | 5,033.0 | |
| Total equity and liabilities | 840.4 | 650.0 | 8,292.5 | 8,476.4 | |
| Statement of comprehensive income for year ending: | 31st August | 1st April | |||
| ASOS | M&S | ||||
| 2017 | 2016 | 2017 | 2016 | ||
| Revenue | 1,923.6 | 1,444.9 | 10,622.0 | 10,555.4 | |
| Cost of sales | (965.3) | (722.7) | (6,534.2) | (6,427.0) | |
| Gross profit | 958.3 | 722.2 | 4,087.8 | 4,128.4 | |
| Distribution expenses | (299.2) | (216.0) | (3,460.4) | (3,412.9) | |
| Administration expenses | (579.5) | (464.1) | (437.4) | (200.8) | |
| Other operating income | 0.0 | 0.0 | 63.2 | 69.4 | |
| Operating profit | 79.6 | 42.1 | 253.2 | 584.1 | |
| Finance income/(Costs) – Net | 0.4 | 0.7 | (76.8) | (95.3) | |
| Profit before tax | 80.0 | 42.8 | 176.4 | 488.8 | |
| Income tax expense | (15.9) | (8.1) | (60.7) | (84.4) | |
| Profit from continuing operations | 64.1 | 34.7 | 115.7 | 404.4 | |
| Discontinued operations | 0.0 | (10.3) | 0.0 | 0.0 | |
| Profit attributable to owners of equity | 64.1 | 24.4 | 115.7 | 404.4 | |
| Other comprehensive income | 12.2 | (67.5) | (44.9) | 268.1 | |
| Total compincome/(loss) for year | 76.3 | (43.1) | 70.8 | 672.5 | |
| Other information: | |||||
| Nominal value per share (£) | 0.035 | 0.035 | 0.250 | 0.250 | |
| No. of Shares (Million) | 82.9 | 82.9 | 1,624.7 | 1,623.0 | |
| Earnings per share (pence) | 76.6 | 29.3 | 30.2 | 34.9 | |
| Dividends per share (pence) | nil | nil | 23.3 | 18.4 | |
| Share price at year end (pence) | 5,667.0 | 4,530.0 | 334.6 | 410.4 | |
| Value of equity (£m) | 4,695.5 | 3,753.4 | 5,436.2 | 6,660.8 | |
| Price earnings ratio | 74.0 | 154.6 | 11.1 | 11.8 | |
| Average p/e ratio for sector | 17 | ||||
| Share price 30 November 2017(pence) | 6,069.0 | 313.2 | |||
| Equity value at 30 November 2017 (£m) | 5,028.6 | 5,088.6 |
NB: Above figures will be updated before the assignment is issued
| Notes on the above information: | |||||||||
| Asset valuations
These have been reviewed for the most recent year and it is thought the figures should be adjusted follows:
|
| The Capital Asset Pricing Model
Assume the risk free rate of return is 3% and the expected return on the market is 6% per cent. Beta has been estimated as follows using two analysts and they have arrived at the following estimates:
|
|||||||||
Non-Current liabilities
Assume non-current liabilities are shown in the statement of financial position at par value and are non-redeemable. |
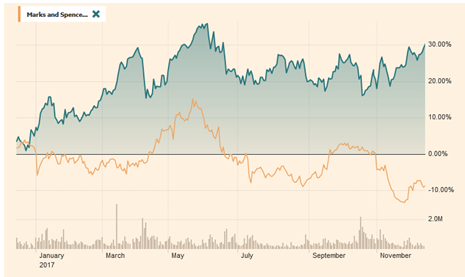
The relative share price movements of the two companies are below
Required:
Task 1: Calculate Value of Asos plc and Marks and Spencer plc for the latest year (Use only the information contained in this assignment)
a) Net asset value
- Calculate the Net asset value per share.
b) Cost of capital
- Calculate the cost of equity capital using the Capital Asset Pricing Model.
- Calculate the cost of debt capital (assume a taxation rate of 20%).
- Calculate the weighted average cost of capital (WACC) using the share price as at 31 Dec 2017 for the value of equity.
c) Dividend growth model
- Basing your calculations on the dividend for 2017, use the dividend growth model to calculate the theoretical price of a share under the following assumptions:
g = 0%
g = 2%
Task 2 Comment on the value of ASOS plc and Marks and Spencer plc Required:
- Use the information from your calculations above and any other information you deem appropriate to arrive at the valuation per share of the two companies.
In doing so critically evaluate the Price-Earnings ratio, Dividend Growth, and the dividend policy.
- You should also relate your calculations to current and historic share price information as appropriate.
- Discuss which company you would advise your client to purchase shares in
The post 3BM070: Strategic Corporate Finance Information for Tasks 1 and 2 You work in the corporate finance department of a major investment bank. One of your clients has expressed an interest in investing in either ASOS (ASC:LSE) or Marks and Spencer (MKS:LSE). You have collected the following information about the two companies: first appeared on Your Answers.